Nifty Trading Strategy | After Post Budget Carnage Watch Out for Crucial 5650 Level


Bookmark and Share

Nifty Futures, post budget presentation of the Finance Minister experienced one of the biggest crashes in recent times. However to us this fall was not unexpected and if you had been reading our previous post we did expect the markets to come down to 5600 levels. After the huge fall all the perma-bulls have been frozen and  bears are sniffing around having tasted fresh blood after many months. However, we have reason to believe that the markets may find support around the 5650 levels and this is going to be a very strong barrier for the bears to overcome before further bear hammering could be initiated.

Technical factors indicate strong support levels around the 5650 levels

If one were to take a look at the chart below its almost magical how the Nifty Futures fall was arrested at the confluence of a number of trend lines, technical patterns and fibonacci retracement levels. Of course this analysis is only in hindsight but the evidence of support is amazingly copy book style.

Nifty-futures-march-4-2013-short-term-support-at-5650

Multiple support levels arrest fall in Nifty Futures

  • Downward sloping Xx trendline
  • Upward sloping trendline Yy
  • The horizontal trend line C drawn from the previous top of 5700(not shown in chart)
  • The parallel channel line MT
  • 5848 is a 33% retracement of the entire rally from the 4700 levels 9again not shown in the chart)
  • And the lower parallel (to the major thick black trendline) passing through T
  • Head and shoulder target shown by the pink arrows

All these together have created a strong energy point around the lows and only if markets are able to sell off below these levels then a further fall would emanate.

Our proprietary short term oscillators are also indicating oversold conditions and the markets should put in a bounce or at least meander till Monday March 11, 2013 which is our energy cycle point for converting price to time. (Please note the vertical blue lines they were draw on the day of the fall and projected backwards in time to test the cycle and it has a margin of error of only 1 day for pin pointing the cycle high and lows !)

If the markets react upwards how will the trend unfold ?

So from all the above we can conclude that markets could recoil until the next energy date which is March 11. As long as the price stays within the channel and does not rally out of the N-O trend line, markets can safely be assumed to be in a downtrend. However if prices were to break this trend line then Nifty Futures has potential to travel to the parallel line drawn from P. Further price should also stay below the  50% retracement level which comes around  5850 levels. In case the rally has legs it could also travel all the way towards the 62% level of 5900.

We will explore this trend projection further in our future posts.

What if the markets were to continue the bear market without correcting upwards.

It is true that we are in a vicious downtrend and going by the price damage that we have seen in the broader market it is quite likely that further down side cannot be ruled out. In fact in one of our previous post we had maintained that prices could go as low as 5500 before end of February.

While our time target was not achieved we still believe, based on Elliot Wave Theory, a terminal impulse is in the offing and should retrace all the way below 5500 latest by March 6, 2013. This scenario is still open and on the break of 5650 we could experience a free fall to 5550 levels. This would mean two days of triple digit losses. Lets see how the next couple of days play out.

What is going to be our trading strategy on Nifty Futures

Since the overall trend is down, we would refrain from buying any calls. Our strategy in case the up move plays out is to write  5900 calls. In case markets break below 5650 then we would initiate a bear put spread by buying 5600 puts and writing 5500 puts.

The spread could be initiated in a staggered manner. So if the markets start selling off, buy the 5600 put and when , if you monitor intraday hourly charts, markets look oversold initiate the put writing for 5500.

Globally along with other BRIC nations, the Indian market was the ugly duckling with the most losses

Despite continued heavy buying by FIIs and successful completion of many IPOs, the broader market has suffered heavy losses and since February 13, 2013 Nifty Futures have fallen very sharply

world-markets-total-returns-chart-march-4-2013

Nifty Futures one of the worst performing global markets

Despite the heavy losses we continue to be one of the most expensive markets

global-market-2-year-earnings-growth-versus-2-year-forward-pe

Nifty valuations in comparison to global continue to remain expensive despite deep cuts

Fundamental expectations fro the market also stand lowered post budget

Analyst consensus earnings estimates on Nifty have also been marginally lowered to 383 (earlier 380) and  435 (440) for CY13 and CY14 respectively.

nifty-earnings-growth-revised-downwards

Nifty earnings revised downwards post budget

nifty-1-year-forward-pe-bands

Nifty fails at mean P/E level could test lower band in the medium term

The 1 Year Forward P/E chart shows that Nifty has a tendency to move from one band to another and the green band of 12.6 FY13 earnings would suggest a Nifty Futures price of 4825. While the number is difficult to digest, who would have thought in the begining of February, when the markets were at 6100 odd levels and bulls were cheering for 6500 – 7000 levels, that the markets would reverse on a dime. We at Winning Trades were the few who successfully forecasted this sell off. In fact we have further bear designs on the future of price of Nifty which we will explore through our blog posts. Stay tuned

What is your view on the market direction? Do you expect the sell off  to continue or you expect consolidation around  present levels? We would love to hear your opinion on the same.

If you enjoyed reading this post  click this to tweet —–> Awesome blogpost!

For daily updates on our trading view on Nifty Futures & Options  please send us an email at bolinjkar.vinit@gmail.com or  SMS / WhatsApp on 9730836363. We would be more than happy to oblige our community of investors / traders.

Disclaimer: The opinions expressed here in are strictly for education purpose only. Before investing please make your own thorough analysis or speak to a qualified Certified Financial Planner / Advisor. We are not in any which way responsible for trading losses arising out of  trading decisions taken based on the above. 

This blog is the personal blog of Vinit Bolinjkar. The views expressed in this article are entirely my own and do not reflect the views of my employer. This report is neither an offer nor a solicitation to purchase or sell securities. The information and views expressed herein are believed to be reliable, but no responsibility (or liability) is accepted for errors of fact or opinion. Writers and contributors may be trading in or have positions in the securities mentioned in their articles. Neither http://winningtrades1.com or myself accepts any liability arising out of the above information/articles.

logo Vinit Bolinjkar Head of Research, Ventura Securities Ltd
Vinit Bolinjkar
Winning Trades
| Mobile: +91- 9730836363

http://winningtrades1.com http://in.linkedin.com/in/vinitbolinjkar

More interesting reading from Winning Trades

 Photo credit: Courier Mail

Bookmark and Share

Nifty Trading Strategy | Agusta Helicopter Scam to take Nifty to the gallows


Bookmark and Share

nifty-crash-agusta-helicopter-scam

In this blog post we explore the impact of the Agusta helicopter scam on the Indian stock markets. Find out what NIfty is expected to do in the aftermath of the scam coming to light?

Augusta scam expose has the unintended consequences of damaging the economic revival

The glaring expose by the Time Now channel of the Agusta helicopter scam and the possibility of  many political bigwigs in the ruling party being involved will be a big handicap to the Finance Minister P. Chidambaram’s plans for a full blown Dalal Street ‘bulls only party’. The sad part is that this expose will bring more questions than answers and like the coal scam and other scams before it will further impact decision making at the policy level. Beaurocrats and politicians will hit the go slow button which has the unintended  consequences of damaging the economic revival and further negating fiscal consolidation.

Mind you this time the Agusta helicopter scam has fool proof evidence of bribes being paid and could crash the ruling party and its dreams for winning the 2014 elections. This is one scam the UPA would wish did not see the light of day. It has virtually opened up the Pandoras box. This could also mean lights out to the bulls party on the bourses. Probably this is the trigger that our Gann analysis of the markets Nifty Futures Sell Off to 5600 on Cards – A Technical View is discounting unconsciously.

Nifty Futures breakdown imminent

nifty-futures-february-14-2013-nifty-breakdown-imminent

Agusta helicopter scam could have untold consequences of damaging sentiment of the markets

Over the last five sessions the Nifty Futures have really held onto the 5880 – 5900 levels supported by the trend line MU. Yesterday it did try to rally but the very trendline XN which provided support the last few months, has now turned resistant and price drifted sharply away from it to 5880 where it has found support from the MU trendline and the 1×2 Gann angle plotted from G. However breakdown from these levels looks imminent and we have forecasted two short term targets based on Fibonacci retracements,  price projection techniques and use of Gann angles.

  • 5835, which is the 50% retracement level of the XY rally and also gets support from the previous bottom and gap area, and
  • 5760 – 5775 which is the 62% retracement level of the XY rally and also the target for 100% range for the trend YU projected from N. Incidently the Gann angle 1×2 drawn from the June 2012 lows also falls in this zone providing a high probability target.

Nifty Futures could crash despite strong global cues from World markets in the medium term

Currently the global markets are experiencing a strong drift upwards due to liquidity and the Asian markets are also expected to rally sharply. Despite the strong global environment for equities we could be the contrarian market given the fact that we are the second most expensive market with low earnings growth expectations amongst the BRIC nations and developed markets. (Nifty Trading Strategy | Overview of Earnings, Valuations and Fund Flows )

Trading Strategy on Nifty Futures- Continue to hold shorts recommended yesterday

We hope you had initiated shorts that we had recommended in our yesterday’s post. We had recommended on the break of 5920 and the markets ended a shade below 5900. We pat ourselves on getting the timing right as currently the market environment is very volatile and extremely difficult to trade. We are targeting 5835 and then 5760 – 5775 from current levels. In case you have bought 5900 Puts, we would suggest writing 5700 Puts during late market hours to protect against time value loss given the weekend holidays. However do not open up a ratio trade.

We would like our readers to bear in mind that the two targets provided  are only short term halts on our projection of 5600 levels of   Nifty on the downside.

What is your view on the market direction? Do you agree with us?  Share your thoughts with us via the following poll

Being informed is being forearmed help us spread awareness of Indian Equity Fundamentals Click this —–> Awesome blogpost!

For daily updates on our trading view on Nifty Futures & Options  please send us an email at bolinjkar.vinit@gmail.com or  SMS / WhatsApp on 9730836363. We would be more than happy to oblige our community of investors / traders.

Disclaimer: The opinions expressed here in are strictly for education purpose only. Before investing please make your own thorough analysis or speak to a qualified Certified Financial Planner / Advisor. We are not in any which way responsible for trading losses arising out of  trading decisions taken based on the above. 

This blog is the personal blog of Vinit Bolinjkar. The views expressed in this article are entirely my own and do not reflect the views of my employer. This report is neither an offer nor a solicitation to purchase or sell securities. The information and views expressed herein are believed to be reliable, but no responsibility (or liability) is accepted for errors of fact or opinion. Writers and contributors may be trading in or have positions in the securities mentioned in their articles. Neither http://winningtrades1.com or myself accepts any liability arising out of the above information/articles.

logo Vinit Bolinjkar Head of Research, Ventura Securities Ltd
Vinit Bolinjkar
Winning Trades
| Mobile: +91- 9730836363

http://winningtrades1.com http://in.linkedin.com/in/vinitbolinjkar

More interesting reading from Winning Trades

 Photo credit: Courier Mail

Bookmark and Share

Nifty Trading Strategy | High Probability of a Downtrend


Bookmark and Share

Nifty Futures were sharply up intraday before giving up all its gains in the latter part of today’s trading session. The up move stalled around 5979 levels a shade higher than our expected level of resistance of 5960 – 5970 levels. We had written in our yesterday’s post  Nifty Trading Strategy | Overview of Earnings, Valuations and Fund Flows that Nifty would face resistance from the down trending channel, the previous peaks and valleys around these levels and the 55 day MA.

nifty-futures-trading-strategy-february-13-2013-stay bearish

More technical weakness emerging in the Nifty Futures Chart

Technical observation point to an internal breakdown

In today’s trade a number of important technical observations were noticed

  • the downward channel was broken (we have reconstructed a new one to include the new price action.
  • two day up move so vital in Gann analysis was established
  • Nifty closed below the 55 day MA for the 4th consecutive day, and
  • the market in the last 4 trading sessions is trading in the same price territory despite the huge intraday volatility

To the bulls we may seem biased, but the third factor is of importance to us as per the Gann school. Any support / resistance level if it remains broken for three consecutive days then the probability of the markets moving in the direction of the breakout increases.

Heavy FII buying and tempered selling by DIIs fails to cheer markets

Despite continued heavy FII purchases (+ Rs 800 crore) and tempered selling by the DIIs (Rs 289 crore), markets gave up all their gains. It proves my strong belief that markets cannot be bought simply on the might of liquidity. Price discovery is done at the margin and is the direct effect of who’s sway rules at the time of the margin trade. Only time will tell if the fund flow bulls would prevail or the sentiment bear traders in this tug of war.

Will the Augusta helicopter scam be the fool proof evidence of the current regime’s corrupt practices

Add to the already muddled politics another scam – this time the Augusta helicopter purchase deal–  pertaining to kickbacks during the Congress regime going back to 2005. What is significant in this case is that the bribe giver has been arrested in Italy. So the question of bribe not being paid does not arise. In my opinion this will really nail the ruling party and cause untold damage to its brand. Let see how the story unfolds. But will FIIs stop buying because of this. Again a million dollar question as they have been buying Indian equities in the recent past at an unexpected pace.

Nifty options data provides clues that point to the down side

Nifty options are also leaving some vital clues. At-the-money (ATM) 5900 Feb Puts OI is nearly 3x the ITM Feb 5900 calls. As per my theory, markets rise as the put call ratio rises but extreme reading serve as contrarian indicators. There is a possibility that the same is being signalled by the PCR ratio of the 5900 strike price. My interpretation is that in case markets sell off below 5855, at that price  all the put writers will run like hell to cover and this could give credence to a violent downside move. We will find out over the next few days. On the other hand the activity at the 6000 strike price is normal and the interpretation is that 6035 would serve as a resistance level.

Recommended Strategy is to buy naked puts below 5920 levels on the Nifty

Summing up all the above we conclude that though markets were oversold, the recent 3 day side ways move has helped markets recover from being oversold. Despite the time relief and today’s price spike, Nifty Futures could not sustain and the weak closing is an indication of more downward price movement to follow. Recommended strategy is to initiate a naked Put purchase should Nifty Futures close below 5920.

So whats your take, will markets sell off or rally to everyone’s delight. Let us know through the poll app below.


For daily updates on our trading view on Nifty Futures & Options  please send us an email at bolinjkar.vinit@gmail.com or  SMS / WhatsApp on 9730836363. We would be more than happy to oblige our community of investors / traders.

Disclaimer: The opinions expressed here in are strictly for education purpose only. Before investing please make your own thorough analysis or speak to a qualified Certified Financial Planner / Advisor. We are not in any which way responsible for trading losses arising out of  trading decisions taken based on the above. 

This blog is the personal blog of Vinit Bolinjkar. The views expressed in this article are entirely my own and do not reflect the views of my employer. This report is neither an offer nor a solicitation to purchase or sell securities. The information and views expressed herein are believed to be reliable, but no responsibility (or liability) is accepted for errors of fact or opinion. Writers and contributors may be trading in or have positions in the securities mentioned in their articles. Neither http://winningtrades1.com or myself accepts any liability arising out of the above information/articles.

logo Vinit Bolinjkar Head of Research, Ventura Securities Ltd
Vinit Bolinjkar
Winning Trades
| Mobile: +91- 9730836363

http://winningtrades1.com http://in.linkedin.com/in/vinitbolinjkar

More interesting reading from Winning Trades


Bookmark and Share

Nifty Trading Strategy | Overview of Earnings, Valuations and Fund Flows


Bookmark and Share

Before discussing the impact  of earnings, valuations and fund flows on the outlook for the direction of  Nifty Futures, we would like to update our readers on the short term technical outlook for the markets.

Click this link to tweet, if you think the article is awesome ——>  Awesome blogpost!

Nifty Futures in a corrective pull back

In our yesterday’s post Nifty Futures Trading strategy | Hold Shorts and Refrain from Option Writing , we had written that there was a possibility for an upward correction to ensue given the short term oversold market. The opportunity was provided by the disappointing IIP figures which provided the exact bear trap in a shallow market bereft of mass participation. Nifty Futures rallied and closed at 5941.40 (higher than our BUY trigger for aggressive players). Hope all the dare devils bought !

The upward correction is expected to continue for sometime and we expect extreme short term resistance around the 5960 – 5970 levels. The resistance comes from the confluence of the 55 day MA, trend line and upper boundary of the channel. In case the move, continues beyond those levels we could expect prices of 6010. So the bears should refrain from putting any short positions until further signals of weakness emanate. Meanwhile the joyous dare devils should continue to hold their long calls with stops around 5920.

nifty-futures-february-12-2013-upward-correction-continues

Just an upward correction; not a sign of green shoots

To share the above self explanatory image of the short term technical update on Twitter click here

In our weekend post Nifty Futures Sell Off to 5600 on Cards – A Technical View, we had examined the case for a bear market scenario. Today we will examine the outlook on Nifty Futures based on earnings growth, valuations and fund flows.

Nifty earning to experience single digit  CAGR growth over the next couple of years

In the back drop of the political imbroglio, lowered savings and investment rate, deteriorating macro fundamentals and triple whammy of ballooning subsidy, sticky inflation coupled with high interest rates and dwindling exports, NIFTY earning are expected to grow at a single digit CAGR over the next couple of years.

While the honorable Finance Minister, P. Chidambaram has made a case for growth to return amidst fiscal tightening, we do not buy the story.  We are of the opinion that things will only get worse unless the government acts with an iron will. Given the low enthusiasm levels of the present UPA government and policy paralysis we are more bearish than bullish. We would be happy to elucidate our reasoning for a bearish case but that would be subject matter of an entire different post.

Current Nifty valuations reasonable but expensive when compared with global markets

In the aftermath of the Euro zone crisis, NIfty valuations had hit rock bottom in 2012. The depressed valuations provided a dream buying opportunity and FIIs made the most of it. However since the low of 4770 established in 2012, the markets have rebounded handsomely and currently NIFTY is trading at mean valuations.

nifty-forward-pe-bands

Nifty valuations have returned to normal post 2012 Euro crisis

Information is power. Empower fellow investors by sharing the above image on Twitter by clicking here

However when valuations are compared to global peers taking into consideration the earnings growth on a 2 year forward basis, Indian markets are not cheap and global markets provide far more compelling opportunities. Given our bearish stand on the growth outlook for the Indian markets, we believe the confidence is misplaced and sooner than later we expect this to correct.

nifty-valuation-comparison-world-markets

Amongst the above peer set Nifty is the second most expensive market with moderate earnings growth over CY12-14

Spread the word about  the high Nifty valuations in comparison to global markets. Tweet this link

Strong FII fund flows sterlized by equally heavy selling by DIIs,  redemptions by retail investors and FPOs.

Since the onset of CY13, FIIs have pumped in a record $ ~7 bn into the Indian equity markets yet the NIFTY returns are negligible. Part of the reason is heavy selling by DIIs coupled with huge FPOs both by the PSU undertakings and the private listed corporates.

FII-india-flows

FIIs pumped nearly USD 7 bn into Indian equity markets since onset of CY13

DFI-india-fund-flows

DFIs have been continuous sellers matching dollar for dollar

world-markets-total-returns-2013-ytd

Despite strong FII flows india market returns have been negligible YTD

Do you believe that the markets will correct sharply as we expect it to?  We would be happy to hear your views in the comments section. Alternately you may participate in the poll below to share your view

Being informed is being forearmed help us spread awareness of Indian Equity Fundamentals Click this —–> Awesome blogpost!

For daily updates on our trading view on Nifty Futures & Options  please send us an email at bolinjkar.vinit@gmail.com or  SMS / WhatsApp on 9730836363. We would be more than happy to oblige our community of investors / traders.

Disclaimer: The opinions expressed here in are strictly for education purpose only. Before investing please make your own thorough analysis or speak to a qualified Certified Financial Planner / Advisor. We are not in any which way responsible for trading losses arising out of  trading decisions taken based on the above. 

This blog is the personal blog of Vinit Bolinjkar. The views expressed in this article are entirely my own and do not reflect the views of my employer. This report is neither an offer nor a solicitation to purchase or sell securities. The information and views expressed herein are believed to be reliable, but no responsibility (or liability) is accepted for errors of fact or opinion. Writers and contributors may be trading in or have positions in the securities mentioned in their articles. Neither http://winningtrades1.com or myself accepts any liability arising out of the above information/articles.

logo Vinit Bolinjkar Head of Research, Ventura Securities Ltd
Vinit Bolinjkar
Winning Trades
| Mobile: +91- 9730836363

http://winningtrades1.com http://in.linkedin.com/in/vinitbolinjkar

More interesting reading from Winning Trades


Bookmark and Share

Nifty Futures Trading strategy | Hold Shorts and Refrain from Option Writing


Bookmark and Share

Nifty Futures traded in an absolutely narrow range throughout the trading session before finally ending the day forming a harami pattern (inside day). In today’s post, we provide a sneak peak into our proprietary trading system. As per the system, the proprietary momentum and lead indicators are both pointing towards a possible short term reversal. Though they have not signaled any reversal of  trend, there could be a small pause in the downtrend before it resumes again.

nifty-futures-trading-system-feb-11-2013.jpg

NIfty Futures could consolidate before resuming the down trend

If you like the above chart please share the love by clicking to Tweet 

Nifty futures trading strategy is to stay with the down trend; however compulsory traders can trade as suggested below

Aggressive traders may initiate longs above Monday’s highs of 5937 with a stop of the low 5905. In case the market sells off  below 5905 then reverse and go short.  Given our longer term bearish forecast we continue to remain bearish and refrain from taking long positions.

Nifty Options – Implied volatility as per historical precedent should spike

Seasonality studies suggest that during the past three years, just about 3 weeks prior to the budget, the implied volatility, as measured by India VIX has always been in the mid twenties and stayed in just about the same range till the budget was presented. This year is marked by a stark contrast where the India VIX is oscillating in the 13-15 range, however it is showing signs of increasing. In anticipation of a spike given the historical precedent and the current low implied volatility, we recommend option buying strategies and would advice against any option writing.

India-VIX-spike anticipated-feb-11-2013

Seasonality suggests a spike in the implied volatility

As per the trading strategy recommended for the Nifty futures, above 5937 naked 5900 calls may be purchased in case markets rally. However if the markets resume the down trend  5900 puts may be purchased below 5905 levels.

Nifty Options Fact Sheet  (infographic)

If you like the below infographic please share the love by clicking to tweet

nifty-options-data-feb-11-2013.jpg

If you like the above  infographic please share the love by clicking to tweet

Refrain from writing options given that the budget event can cause volatility to spike

For daily updates on our trading view on Nifty Futures & Options  please send us an email at bolinjkar.vinit@gmail.com or  SMS / WhatsApp on 9730836363. We would be more than happy to oblige our community of investors / traders.

Disclaimer: The opinions expressed here in are strictly for education pupose only. Before investing please make your own thorough analysis or speak to a qualified Certified Financial Planner / Advisor. We are not in any which way responsible for trading losses arising out of  trading decisions taken based on the above. Also read the disclaimer below.

This blog is the personal blog of Vinit Bolinjkar. The views expressed in this article are entirely my own and do not reflect the views of my employer. This report is neither an offer nor a solicitation to purchase or sell securities. The information and views expressed herein are believed to be reliable, but no responsibility (or liability) is accepted for errors of fact or opinion. Writers and contributors may be trading in or have positions in the securities mentioned in their articles. Neither http://winningtrades1.com or myself accepts any liability arising out of the above information/articles.

logo Vinit Bolinjkar Head of Research, Ventura Securities Ltd
Vinit Bolinjkar
Winning Trades
| Mobile: +91- 9730836363

http://winningtrades1.com

http://in.linkedin.com/in/vinitbolinjkar

More interesting reading from Winning Trades


Bookmark and Share

Nifty Futures Sell Off to 5600 on Cards – A Technical View


Bookmark and Share

Nifty Futures seem poised for a sell off after having advanced a hefty 1342 points from the early June 2012 lows of 4770 to 6112.  In this blog post we  outline the technical factors due to which this decline could ensue.

Anecdotal evidence suggests that Nifty Futures have topped out

Nifty after forming a bottom at 4770 in early June 2012 has rallied sharply for nearly eight months on the back of  global liquidity.  The upward campaign has played out in a classical 3 forms (indicated by 1, 2 and 3 on the chart) as explained in Gann Theory. The Nifty Futures topped out at 6120 and since then we have seen a correction to this rally.  The anecdotal evidence suggests that the market has topped out and we are in for a major decline that could see the market decline sharply to levels much lower than 5600.

nifty-futures-headed-to-5600-technical-analysis-feb-2013

Technical factors indicate top is in and Nifty can slip to 5600 and eventually much lower

While it is a fact that the whether a top is in place is only a matter of conjecture, certain price action since the high of 6120 strongly indicate so. For confirmation,  we would require a price movement which is both faster in time and price than the largest of the previous three forms. This faster time and price targets are indicated by the boundaries of the green rectangle and suggest prices falling below 5500 before the end of February. Currently at the time of writing this blog post the market is at 5903, so only time will tell if this would pan out.

The technical support would incidently come from the 200 day MA, downward sloping Gann Angle line drawn from point M. and  the continuation gap (July 2012) between between 5450 and 5550 levels. 

Short term technical support exists at 5850 – 5875 levels     

The market has been in a slow free fall since the beginning of February and has taken support on the thick black trend line drawn from the higher bottom established in late July 2012. This is the fourth touch point on the trend line (see points a, b, c and d) and as per Gann’s Rule of 4, if this trend line is broken after 4 touch points it would mean further down sides. This trend line and the 55 day moving average (represented by the blue dashed line) along with minor penetrations has provided good support to the market in the past. However we have to remember that we are in the 4th touch point and there exists a very high probability of a break of trend line.

Another support indicator is the green coloured Gann Angle Lines. The third form which started from the point c, has largely stayed above the Gann 1×1 angle line (bold golden line). Once this line was broken, then as per Gann Angle Lines laws, market would seek support on the next angle, that is, the 1×2 angle line. Support from this line exists around the 5850 – 5875 levels. Minor support also comes from the black 2-M trend line at 5840.

So we have a confluence of the trend lines, 55 MA and the 1×2 Gann Angle Line providing short term support between 5840 and 5875. However the over powering force of the overall downtrend would eventually play out and overcome this short term support.

Checks to monitor that the down trend is intact

While we cannot rule out short term pull backs, we need to keep certain checks in mind which could provide evidence that the market might resume its up trend and nullify our forecast. As long as the market stays below the thick pink downward sloping 1×1 Gann Line, we can clearly assume that the down trend is  intact. Even if the market breaks the 1×1 line on the upside it should not rally beyond 6110 – 6120 levels which is the 50% retracement level and one of Gann’s favorite indicators.

Incase you would like to receive daily updates on our trading view on Nifty Futures  please send us an email at bolinjkar.vinit@gmail.com or SMS on 9730836363. We would be more than happy to oblige our community of investors / traders.

Before investing please make your own thorough analysis or speak to a qualified Certified Financial Planner / Advisor. Also read the disclaimer below.

Disclaimer: This blog is the personal blog of Vinit Bolinjkar. The views expressed in this article are entirely my own and do not reflect the views of my employer. This report is neither an offer nor a solicitation to purchase or sell securities. The information and views expressed herein are believed to be reliable, but no responsibility (or liability) is accepted for errors of fact or opinion. Writers and contributors may be trading in or have positions in the securities mentioned in their articles. Neither http://winningtrades1.com or myself accepts any liability arising out of the above information/articles.

logo Vinit Bolinjkar Head of Research, Ventura Securities Ltd
Vinit Bolinjkar
Winning Trades
| Mobile: +91- 9730836363

http://winningtrades1.com

http://in.linkedin.com/in/vinitbolinjkar

More interesting reading from Winning Trades


Bookmark and Share

Sun TV | Low Risk High Gain Stock to Power Your Portfolio


Bookmark and Share

 SUN TV logoSun TV Networks Ltd. is one stock idea which is available at extremely attractive valuations along with added benefits of it being low risk. In my opinion the business has significantly stable annuity income stream with long term visibility. Whats more is that  the market has not comprehended the gains that the media broadcasters are going to reap especially with the implementation of the digitization policy.
Sun TV is going to experience the full impact of the 1st phase of digitization during the first half of calendar 2013, when Chennai with 2 mn households become paying subscribers. Additionally the 2nd phase of digitization which is to be implemented in the 5 cities of Bangalore, Hyderabad, Mysore, Coimbatore and Vishakhapatnam cumulatively will see 11 mn households become paying subscribers in the calendar year 2013.

(For more information on the digitization policy and its impact please refer our blog article DEN networks – a multi bagger stock idea for India)

In addition the recent TRAI recommendation that state bodies be disallowed from entering the media broadcasting and distribution phase should augur well for Sun TV. Arasu the Tamil Nadu state distribution MSO should no longer be a threat to Sun TV and the company should be able to regain its lost market share and also rebuild its lost advertising revenues.

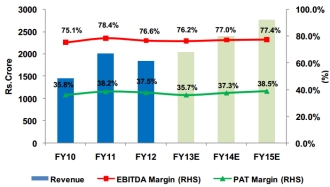
Keeping in mind the above, we expect Sun TV’s revenues to grow at a CAGR of 14.6% to 2778 crore  while PAT is expected to grow at a slightly faster clip of 15.6% CAGR to Rs 1070 crore over the period FY12-FY15.

Sun TV revenue and profit growth

Strong revenue & profit growth on the cards for Sun TV

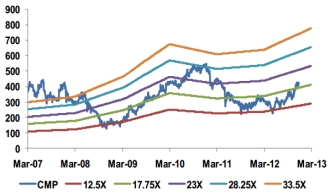
I recommend a BUY on the stock with a price target range of between 23x and 29x PE multiples on FY15 earnings giving a target range of Rs 625 – 788 (depending on the  sentiment prevailing in the market).  Historically Sun TVs average PE has been around 23x giving a price target of 625. However, if one were to look at the valuation bands, the stock has often exceeded this PE and traded at much higher multiples.

SunTV-Valuation_chart

Sun TV is quoting significantly below historic 1 yr forward valuations

Sun TV Networks Ltd meteoric rise is expected due its

  1. Unique business model,
  2. Strong pull of its SUN TV brand and
  3. Consequent advertising premiums that its gets,
  4. Support from the digitization of the media business which will stop non paying subscribers.
  5. Strong DTH presence
  6. Compelling valuations

Lets explore & understand how each of the above is adding value to its business.

Sun TV’s business model is vastly different from the rest of the industry players.

Unlike other GEC (General Entertainment Channels) players it leases out its prime time slots on 30 minutes basis to third party content producers for a fixed “Broadcast fee.” For this leased prime time, Sun TV maintains two minutes of advertising time with itself while 4 minutes is provided to the lessee for every 30 minutes. Since the time is leased, the content is not “owned” by the company and hence the cost of the content and risks associated are also not borne by it.

In order to ensure that the prime time program is of high quality and TRPs do not erode, Sun TV incorporates certain clauses in its agreements with its prime time lessees which states that

  • If certain level of ratings for the content aired are not maintained  Sun TV has right to change their slot timings or can also stop           telecasting the content.
  • The producer will work exclusively for Sun TV during the period of agreement.
  • After the agreement  expires, the producer cannot telecast that serial on any other network for the next two years.

Moreover ~75% of the non prime time content is sourced in-house out out of which 40-45% is movie based, 8-10% is news and the rest is accounted by game, talk and variety shows which further lowers its production costs.

Sun TV along with its network of 32 channels is a dominant player in the the four key South Indian states of Tamil Nadu, Andhra Pradesh, Karnataka and Kerala (leader in 3 out of 4 markets). The pull of its brand is so strong that even when it was dropped by Arasu Cable (Tamil Nadu state owned cable operator), it continued to maintain its leadership position with marginal impact on it viewership ratings on the back of its continued visibility in Chennai, its availability on DTH platform across Tamil Nadu and presence of piracy, to a certain extent, in the state.

This strong brand pull has enabled Sun TV to charge premium advertising rates as is visible from the self explanatory table shown below

Sun_strong_brand_pull_enables_premium_advertising_rates

Sun TVs dominant position in southern ad-market

Going ahead, the regional TV ad market growth is likely to outpace the national TV ad market as the potential of growth in consumption of various products is greater in regional markets.  We expect Sun TV’s ad revenue to grow at a CAGR of 11.3% to Rs 1,304.5 crore from  Rs 945.4 crore over the period of FY12-FY15 on the back of improved ad spends and increased visibility in Tamil Nadu

Digitzation to spurt cable subscription revenues and this should boost profitability significantly besides providing long term revenue visibility thus improving valuations.

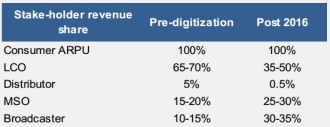
Prior to passing of the digitization bill the industry was plagued by massive under reporting. It is estimated that this reporting was to the tune of 85%.  Now with digitization, the last mine cable operator (LCO) has effectively lost control and all numbers would be accounted for. Further, if subscribers do not pay their monthly dues their signals will inadvertently be cut off.  Phase I of digitzation is a huge success and as the process is rolled out pan India over the next three to four years, revenues of the media industry and broadcasters will only improve.

SunTV_roadmap_to_digitization

Roadmap to digitization for the Indian cable industry

SunTV_broadcaster_share_of_revenue_to_grow_significantly

Broadcaster share of revenue to grow significantly

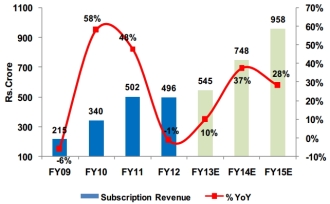
With ~2 mn households in Chennai (~1.3-1.5 mn cable subscribers and ~0.5 mn DTH subscribers) and ~11 mn subscribers in five cities of Phase II (Bangalore, Hyderabad, Mysore, Coimbatore and Vishakhapatnam), Sun TV is expected to be one of the biggest beneficiaries.  We expect cable subscription revenues growing at a CAGR of 30.2% to Rs 360 crore. Along with cable subscription revenues, DTH revenues are also expected to undergo strong traction and  reach Rs 600 crore by FY15 (CAGR of 21.6%).

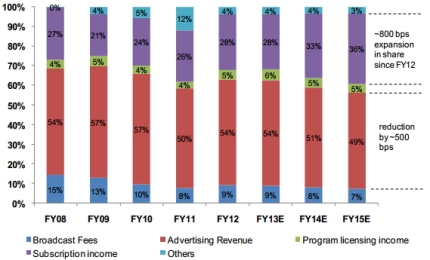
Overall domestic subscription revenues (DTH + Cable) are expected to grow at a CAGR of  24.6% to `958.3 crore by FY15 from the current FY12 revenues of Rs 495.6 crore with share of subscription revenue expected to increase by a whopping 760 bps to 36%. Our forecast is based on conservative estimates as we believe that in order to ensure smooth implementation of DAS, broadcasters will not rock the boat and will go in for negotiated basis pricing with MSOs in place of a complete revenue per subscriber model.

SunTV_subscription_revenues

Sun TV subscription revenues to grow at a CAGR of 25% till FY15

Other businesses like international subscription and movei business to maintain an overall steady state of growth. However the overall subscription mix is expecte to change going forward as shown below

SunTV_revenue_composition

SunTV Revenue Composition to change going forward

Valuations of Sun TV Network Ltd. are compelling with low risk. Recommend a BUY with a target range of Rs 625 – 788 depending upon the market sentiment.

So what do you think of Sun TV? Let us know. Incase you would like to be updated on the future developments in Sun TV please send us an email at bolinjkar.vinit@gmail.com or Whatsapp on 9730836363. We would be more than happy to oblige our community of Sun TV investors / traders.

Before investing please make your own thorough analysis or speak to a qualified Certified Financial Planner / Advisor. Also read the disclaimer below.

Disclaimer: This blog is the personal blog of Vinit Bolinjkar. The views expressed in this article are entirely my own and do not reflect the views of my employer. This report is neither an offer nor a solicitation to purchase or sell securities. The information and views expressed herein are believed to be reliable, but no responsibility (or liability) is accepted for errors of fact or opinion. Writers and contributors may be trading in or have positions in the securities mentioned in their articles. Neither http://winningtrades1.com or myself accepts any liability arising out of the above information/articles.

logo Vinit Bolinjkar Head of Research, Ventura Securities Ltd
Vinit Bolinjkar
Winning Trades
| Mobile: +91- 9730836363

http://winningtrades1.com

http://in.linkedin.com/in/vinitbolinjkar

More interesting reading from Winning Trades

Related Articles
Bookmark and Share

Find Out Where Silver Prices are Headed in 2013


Bookmark and Share

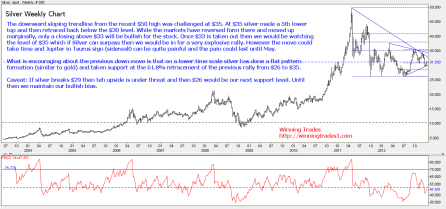
Which way is silver headed in 2013?  Silver prices since  mid 2011 have been tightly clasped in a broad band between $37 on the upside and $26 on the downside. While the initial oscillations had been large, off late the movement without giving clues to direction is oscillating in a narrow range of $35- $29. While the price movement has been directionless, we thought that before undertaking an analysis of the fundamentals we should undertake a quick  technical analysis of the spot silver prices to spot for clues of the likely future movement.

Silver Technicals not giving clues to market direction

Silver Update January 3, 2012

Silver saddled between $29 and $33

The downward sloping trend line from the recent $50 high was challenged at $35. At $35 silver made a 5th lower top and then retraced back below the $30 level. While the markets have reversed form there and moved up marginally, only a closing above $33 will be bullish for the stock. Once $33 is taken out then we would be watching the level of $35, which if Silver can surpass, then we would be in for a very explosive rally. However the move could take time and Jupiter in Taurus sign (sidereal) can be quite painful and the pain could last until May.

What is encouraging about the previous down move is that on a lower time scale silver has done a flat pattern formation (similar to gold) and taken support at the 61.8% retracement of the previous rally from $26 to $35. One eminent Technical Analyst, Alf Fields expects that the recent take down of the precious metals clearly indicates that the correction is almost over and prices should now start storming on their way up. [Link]

Caveat: If silver breaks $29 then the upside is under threat and then $26 would be our next support level. Until then we maintain our bullish bias.

Meanwhile Fundamental factor predict the tug war to continue

The global economic price drivers  are virtually intact -.

  • Silver Coin sales and ETF investment remains at an extremely high level
  • Central Banks  continue to be buyers of  gold at all price points
  • Asians continue to be big buyers of precious metals, gold and silver,.In particular China is rumoured to be a very aggressive buyer of Gold to augment its reserves. Once this is made “official” the prices of gold would only go through the roof and silver is expected to follow it in sentiment
  • On the supply side, the underground reserves are good for only about 8 -10 years.
  • New resource finds are trailing requirements
  • Above ground reserves have virtually dried up. Its only time before the demand supply equation breaks up and the shortages loom to raise the prices of silver.
  • The mindless printing of money by global Central Banks to counter the economic turmoil is almost certainly going to cause rapidly rising inflation; which is a big positive for precious metals.
  • The recent fiscal cliff resolve is not expected to lead to any budget cuts and the Feds dollar for debt program is expected to lead to enhancing debt by nearly $ 4 tr.

Despite the relative bullish background for the long term price of silver certain events which have taken place in recent time could keep the lid on the price of silver.

  • India, which is a major buyer of gold along with China, is expected to reign in gold imports through increasing duties and imposing restrictions on import quantities. These restrictions are being applied to shore up precious foreign exchange and curb the countries widening fiscal deficit. This could lower demand for gold and ease demand supply pressures and lower gold prices. This in turn would affect the price of silver as both are closely related. 
  • Demand for silver from the solar photovoltaic industry was much lower than anticipated in 2012. With increasing prices of silver, the solar cells industry cut back on the usage of solar paste leading to a fall in silver consumption to 40 mn oz from the previous year’s record breaking 60 mn oz. Although the solar cells industry is expected to grow at 10%, it remains to be seen how much the industry scales back on silver consumption. With no substitute for silver, it is not expected to decline much. However growth would be slower than anticipated previously.

Considering all the above we believe that prices would continue to remain directionless and hence Silver technicals should be  the first indication for future price direction. We would be mildly bullish on the event prices break $33 on the upside and go short should $29 be violated on the downside decisively.

So where do you think the price of silver is headed ? Let us know what you think.

Before investing please make your own thorough analysis or speak to a qualified Certified Financial Planner / Advisor. Also read the disclaimer below.

Disclaimer: This blog is the personal blog of Vinit Bolinjkar. The views expressed in this article are entirely my own and do not reflect the views of my employer. This report is neither an offer nor a solicitation to purchase or sell securities. The information and views expressed herein are believed to be reliable, but no responsibility (or liability) is accepted for errors of fact or opinion. Writers and contributors may be trading in or have positions in the securities mentioned in their articles. Neither http://winningtrades1.com or myself accepts any liability arising out of the above information/articles.

logo
Vinit Bolinjkar Head of Research, Ventura Securities Ltd
Vinit Bolinjkar
Winning Trades
Tel: | Mobile: +91- 9730836363

http://winningtrades1.com

http://in.linkedin.com/in/vinitbolinjkar

More interesting reading from Winning Trades

Bookmark and Share

Technical Outlook of the Indian Pharmaceutical Sector December 2012


Bookmark and Share

The Indian Pharmaceutical sector has been on a roll ever since the global economy picked itself up post the 2007 mayhem.  Given the    strong fundamentals of the Indian Pharmaceutical industry and the global opportunity due to the patent cliff in the western world, listed pharmaceutical stocks have responded well and rallied substantially. While the international opportunities have been good for the bottom line, pharmaceutical stocks with a larger or significant share of the domestic  pharma market have come in for a rude shock as the implementation of the new pricing policy outline of the NPPA can sharply erode profitability. As the policy elements are still not clear, it would be premature to judge how individual companies would be affected.

With a view to having a mid journey  outlook on expected price performance of  pharmaceutical stocks,  we decided to conduct a study of the major pharmaceutical stocks using technical analysis and analyse which stocks offer the best opportunity both from a long and short point of view. The exhaustive analysis was done on 29 of the major stocks, the details of which one can obtained from the slideshow embedded below.


The analysis was done using weekly chart data to get a more longer term picture and some of the results we found were quite contrary to general market expectation; yet others were quite revealing of exciting investment opportunities. We could have easily summed up our analysis and provided an instant listing of our analysis and recommendations for the benefit of our blog readers, but we thought it more appropriate that the reader “visualize” our analysis as “one picture is worth more than a thousand words.”

Technical analysis is a great science for stock price forecasting, but the overall investment decision can be more solid  if backed by  hard core fundamental study.  In part 2 of the Indian Pharmaceutical Outlook, we would be providing extremely high quality fundamental evaluation on the fortunes of these very 29 stocks so that our faithful blog readers can make investment decisions based on comprehensive analysis.

As with all the content on this blog, the report will be provided FREE. However in order to make a point of the exclusivity of the content, we request blog readers to send us an email so that we could deliver it directly in your email inbox. This we request so that we could obtain your feedback on the same report so that we can improve on the content.  We would also like to solicit your opinion on the type of content that readers find interesting so that future blog posts could be based more on reader interest rather than just what we think you should read.

request for indian pharma sector fundamental outlook

Dont worry we wont sell your email id. If we wanted to monetize our site we would have kept the blog content paid !

So please drop us an email at bolinjkar.vinit@gmail.com in case you would like to receive the report.

Hope you enjoy reading the Technical Outlook of the Indian Pharmaceutical Sector December 2012 as much as I enjoyed creating it.  So tell us which is your favourite pharma stock.

Disclaimer: The views expressed in this article are entirely my own and do not reflect the views of my employer. This report is neither an offer nor a solicitation to purchase or sell securities. The information and views expressed herein are believed to be reliable, but no responsibility (or liability) is accepted for errors of fact or opinion. Writers and contributors may be trading in or have positions in the securities mentioned in their articles. Neither http://winningtrades1.com or myself accepts any liability arising out of the above information/articles.

logo
Vinit Bolinjkar Head of Research, Ventura Securities Ltd
Vinit Bolinjkar
Winning Trades
Tel: | Mobile: +91- 9730836363

http://winningtrades1.com

http://in.linkedin.com/in/vinitbolinjkar

Bookmark and Share